Introduction
On Friday, Microsoft released the latest Technical Preview release for Microsoft Endpoint Manager Configuration Manager, namely version 2010. As always, it contains a bunch of new features (based on uservoice feedback) and I’ll take a look at some of them here.
Syntax highlighting
To assist you when creating scripts and queries in the Configuration Manager console, you’ll now see syntax highlighting. Supported languages for syntax highlighting include PowerShell, JavaScript/JScript, VBScript, and SQL/WQL. So let’s take a look.
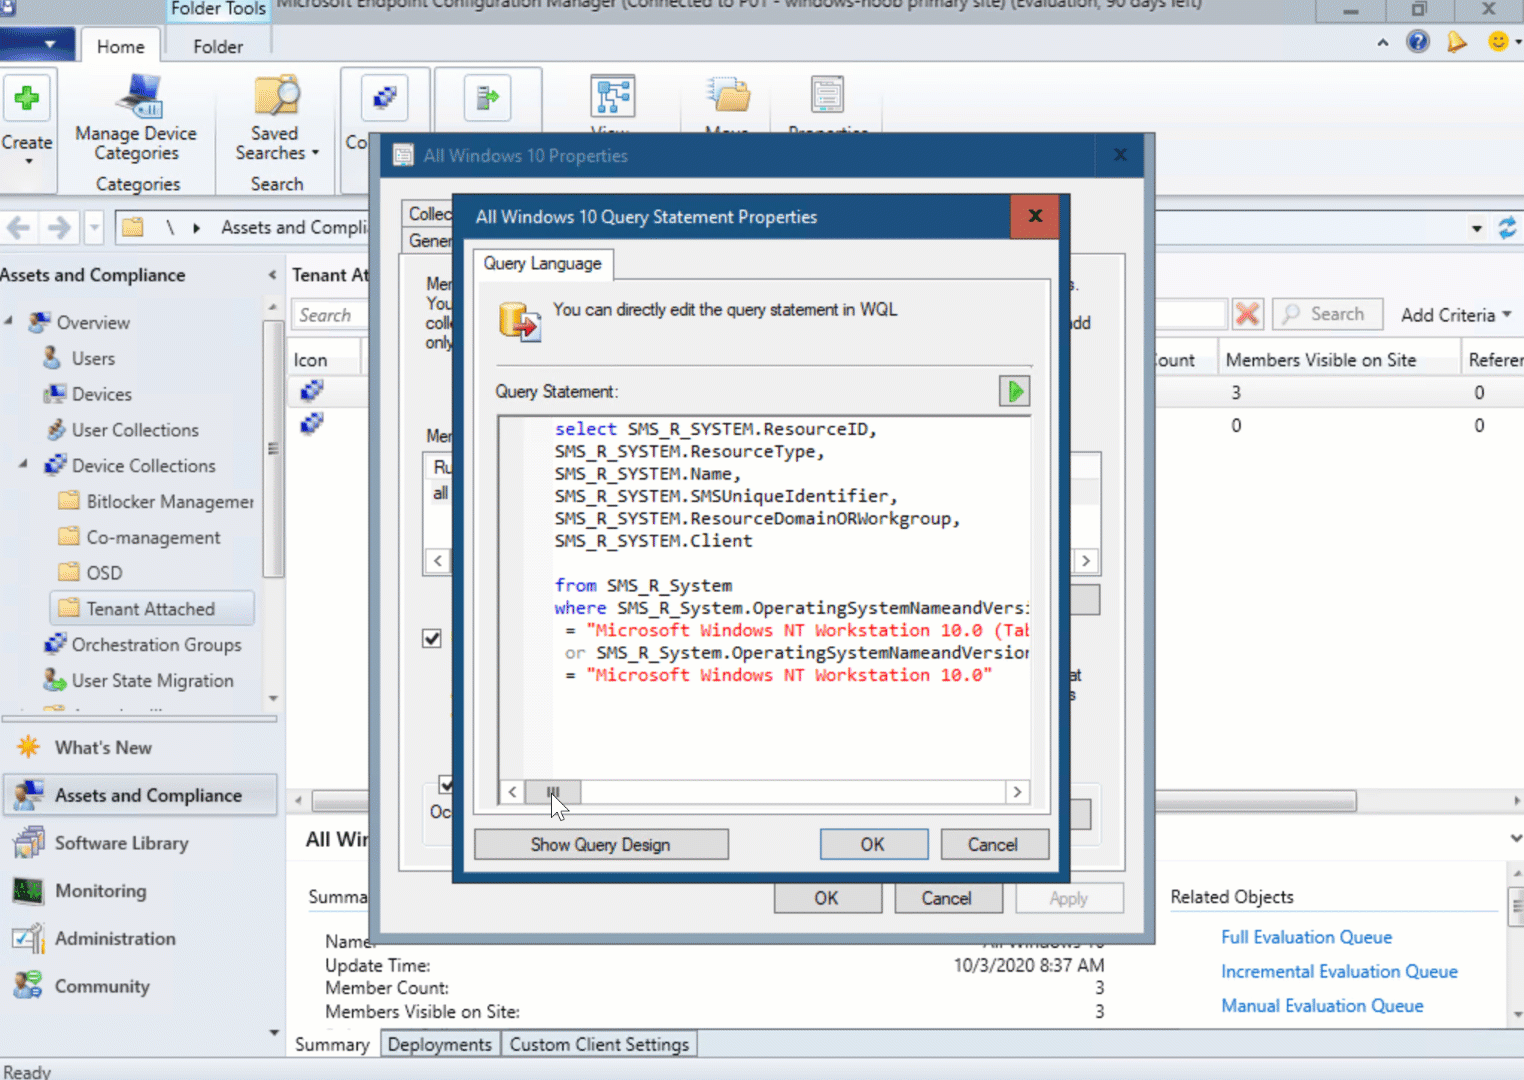
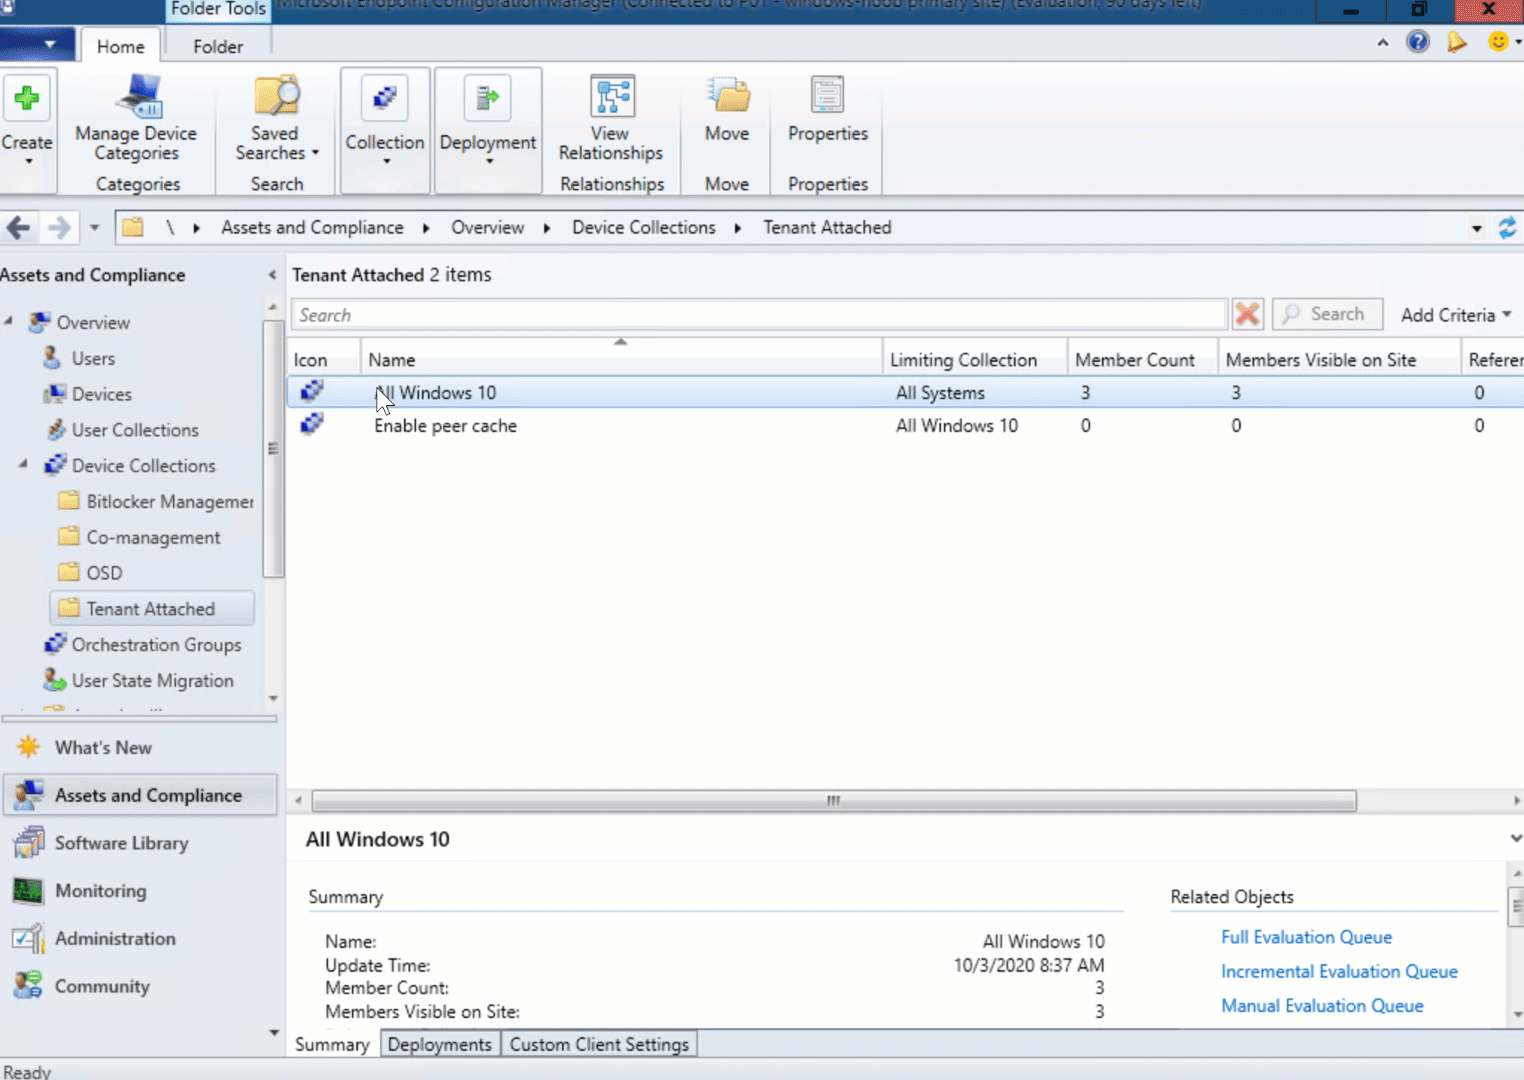
If I look at a All Windows 10 collection query (Windows Management Instrumentation Query Language or WQL), and click on Show Query Language I get a hint of the syntax highlighting in action.
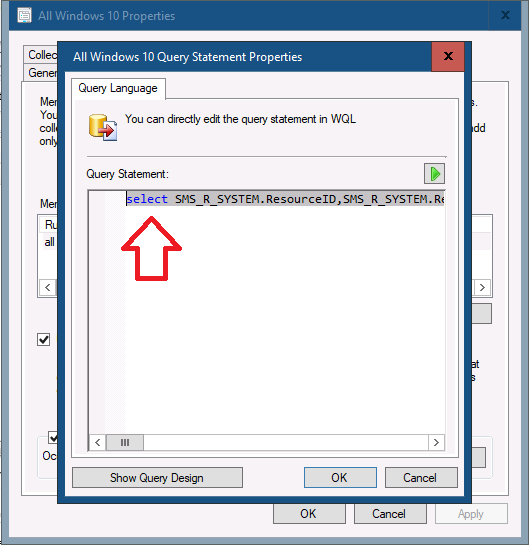
I say a hint of the syntax highlighting as only one word is actually highlighted in the screenshot, due to the query stretching far over to the right of the window show, and unfortunately you cannot stretch the window.
You can however get creative and modify the carriage returns in your query so that it’ll display most of the query in one window. Like so.
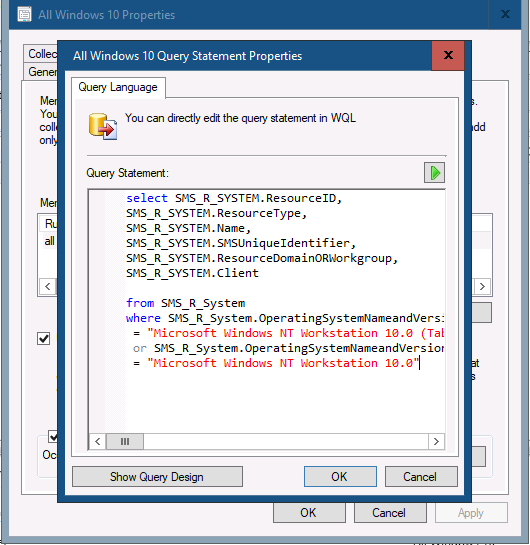 While this shows the query more clearly, you still miss out on some parts of the query visually, and there’s wasted space to the left of the query statement window. Let me demonstrate.
 However, editing your WQL queries like this to give better visibility to the structure is only a temporary measure, because once you apply the changes the next time you go back to view the query it’s all on one line again but now complete with extra spacing.
 If we look at syntax highlighting for Powershell scripts, it looks more readable but again you cannot stretch the window and have to scroll right in order to view the entire contents (as well as scroll down if it’s a long script).
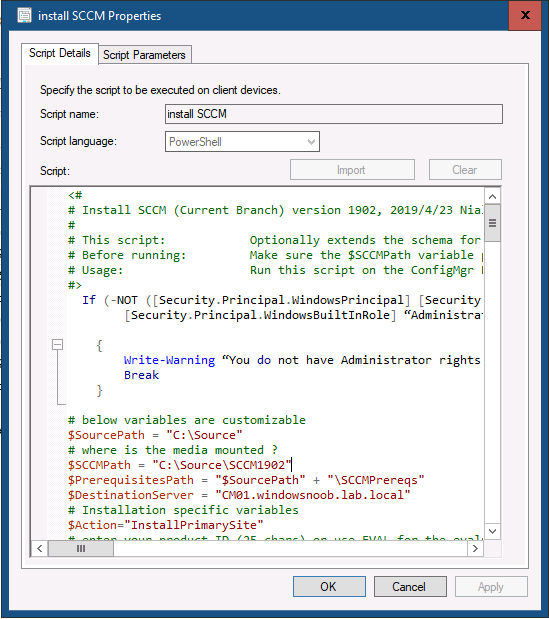 But still, this is a vast improvement on where it used to be. Thanks for this great feature ! You can read more about this new feature here.
More info > https://docs.microsoft.com/mem/configmgr/core/get-started/2020/technical-preview-2010#bkmk_syntax
Deploy task sequence to a User
You can now deploy a non-OS deployment task sequence to a user-based collection.
More info > https://docs.microsoft.com/en-us/mem/configmgr/core/get-started/2020/technical-preview-2010#bkmk_tsdt
Note: Use the task sequence deployment type of an application to install or uninstall it.
Prerequisites for a task sequence deployment type
Create a custom task sequence:
- Use only non-OS deployment steps, for example: Install Package, Run Command Line, or Run PowerShell Script. For more information including the full list of supported steps, see Create a task sequence for non-OS deployments.
- On the task sequence properties, User Notification tab, don’t select the option for a high-impact task sequence.
When you create the application, to add a task sequence deployment type, your user account needs permission to read task sequences. Use one of the following options to configure these permissions:
- Add the app administrator’s user account to the built-in Read-Only Analyst role. This role allows them to view all Configuration Manager objects.
- Copy the built-in Application Administrator role to create a custom role. Add the Read permission on the Task Sequence Package object.
Known issues for a task sequence deployment type
-
- You can’t yet deploy an app task sequence to a user collection
- Don’t use the Install Application step in this task sequence. Use the Install Package step to install apps.
Ok, so now we have the needed info, let’s try it. I created some custom task sequences with packages or apps and tried to deploy these task sequence(s) to User collections. It didn’t work for me.I could only deploy task sequences to Device Collections.
So I re-read the docs.
So I guess the doc’s are a little bit confusing. Instead of deploying the Task Sequence, you are supposed to create an application, and modify it’s Deployment type to install the custom task sequence.
Steps to test this
- create a custom task sequence with a package (I created a notepad++ package and used that in the Install Package step…)
- create a custom app with a deployment type of Task sequence
- deploy to user(s)
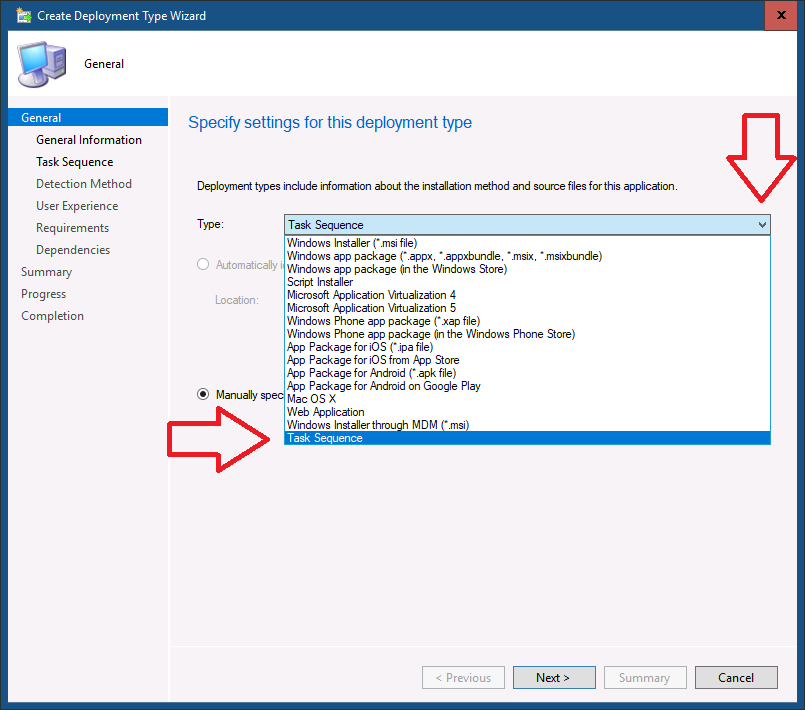
So the 1st step is easy, once done go ahead and create a new application, like so.
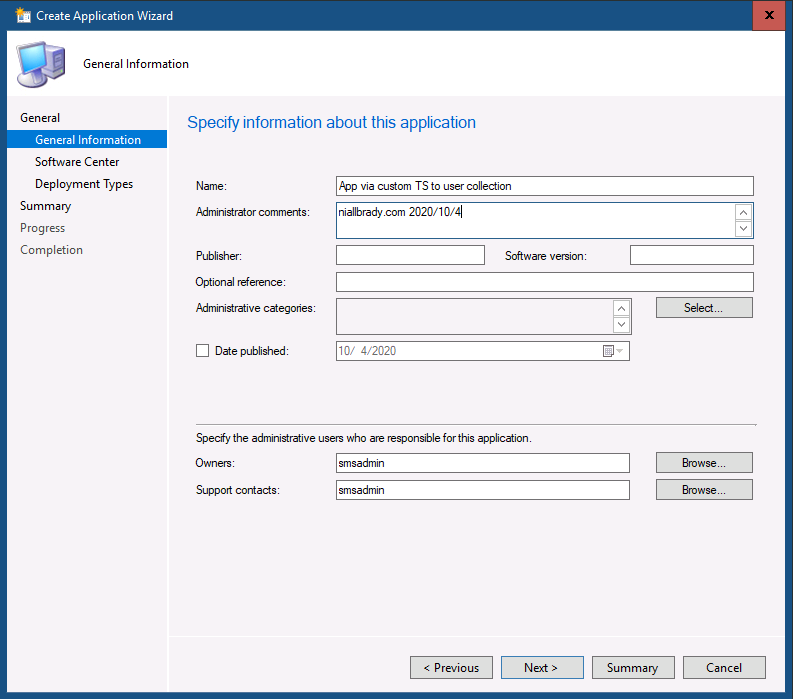 choose the Task Sequence option for Deployment Type information
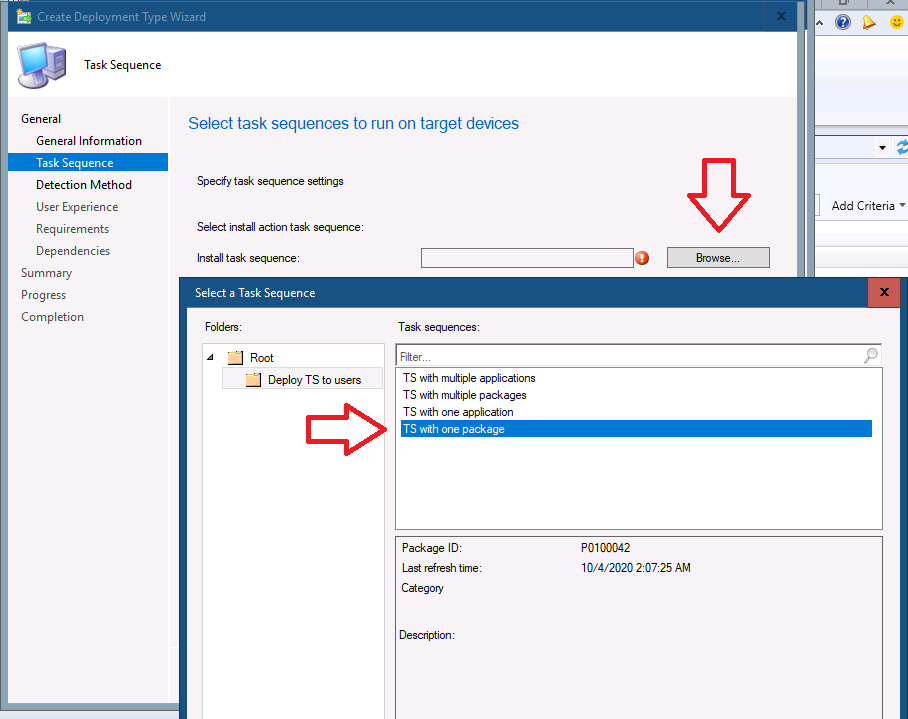
 on the Specify task sequence to run, browse to your previously created task sequence with an install package step…
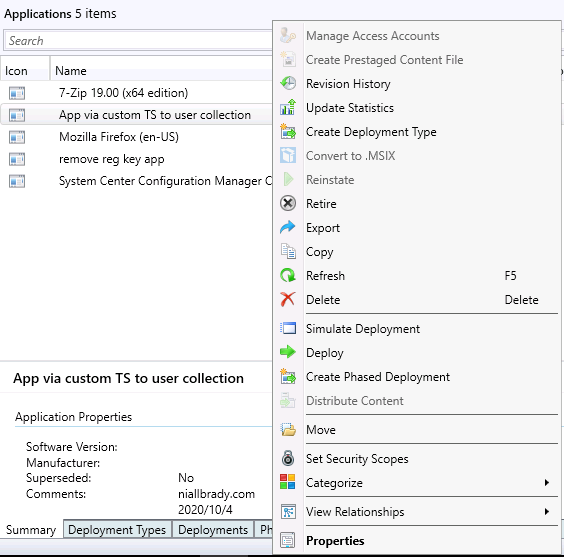
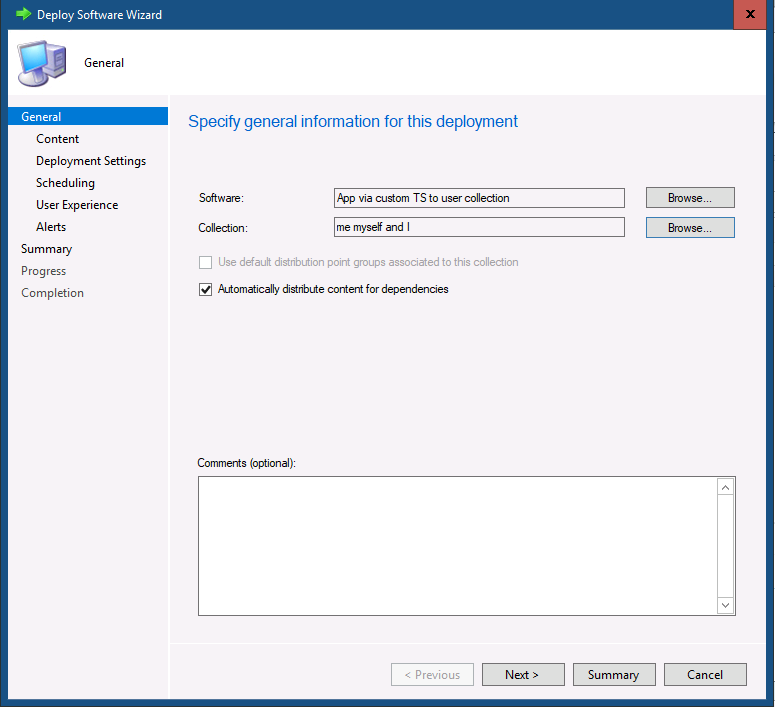
 Once done, deploy the Application as required to a User collection.
 After creating this custom app and configuring the Deployment Type to use my Custom Task Sequence containing one package (notepad++) I logged in to a recently deployed Windows 10 client and … after a few minutes the app appeared.
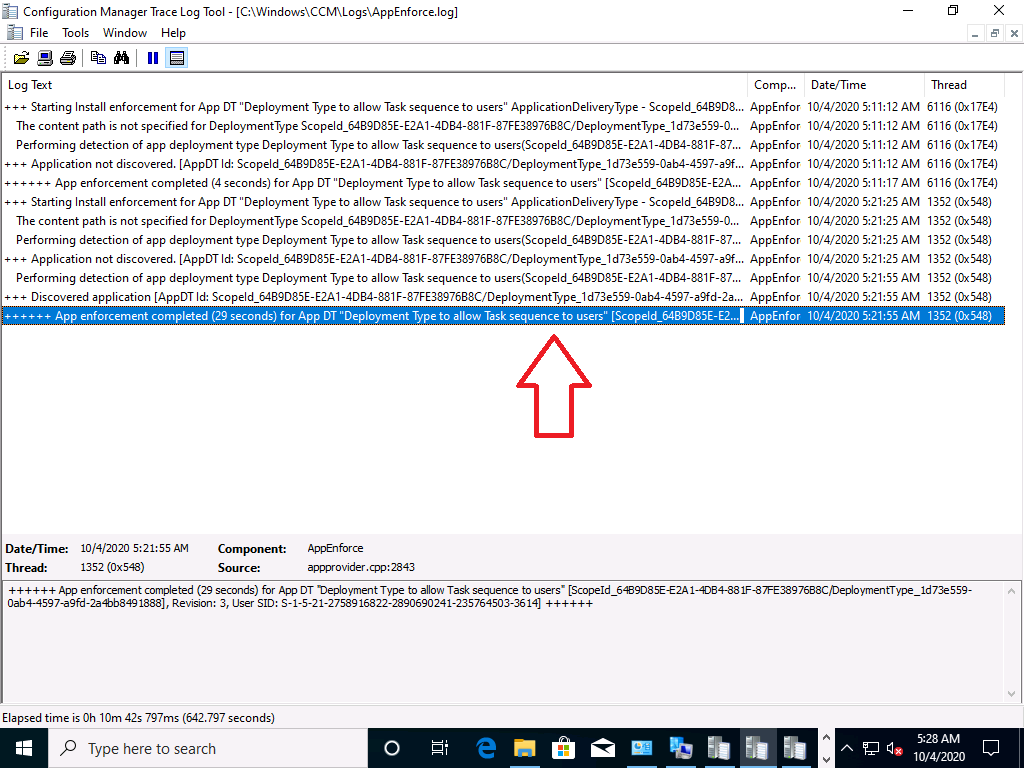
You can use the normal app*.log files in C:\Windows\CCM\logs to troubleshoot even though this was in fact a package references in a task sequence!.
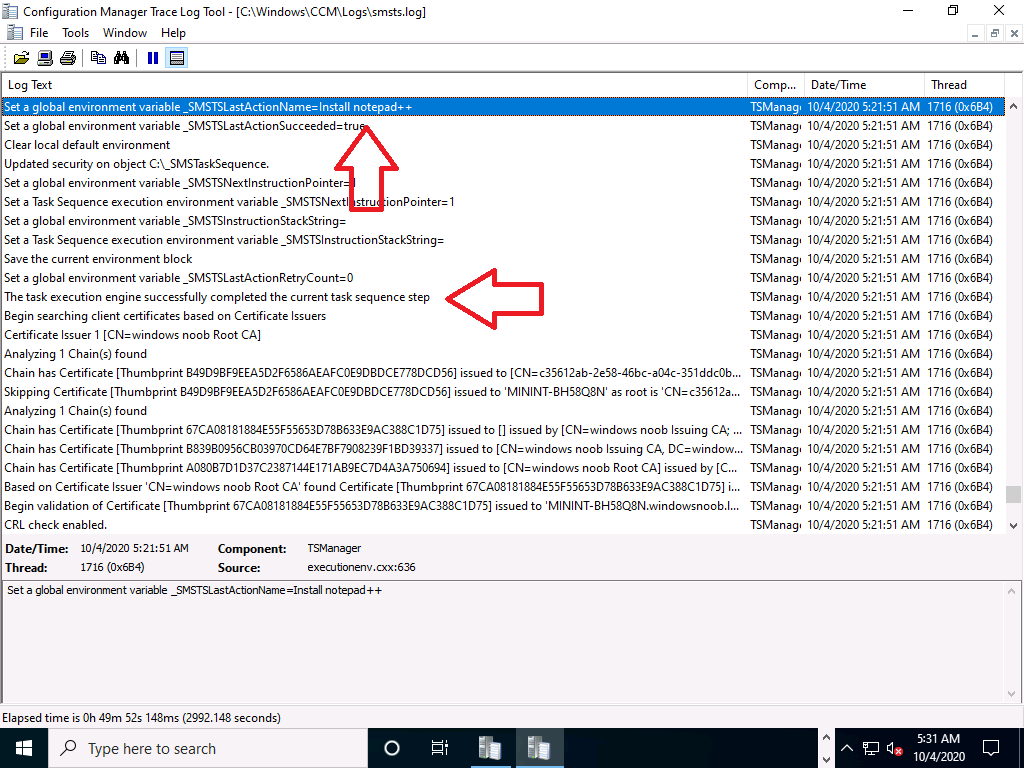
 and of course, as this was initiated via a completely separate task sequence to the one used for deploying my actual computer, I can review the SMSTS.log to see evidence of that.
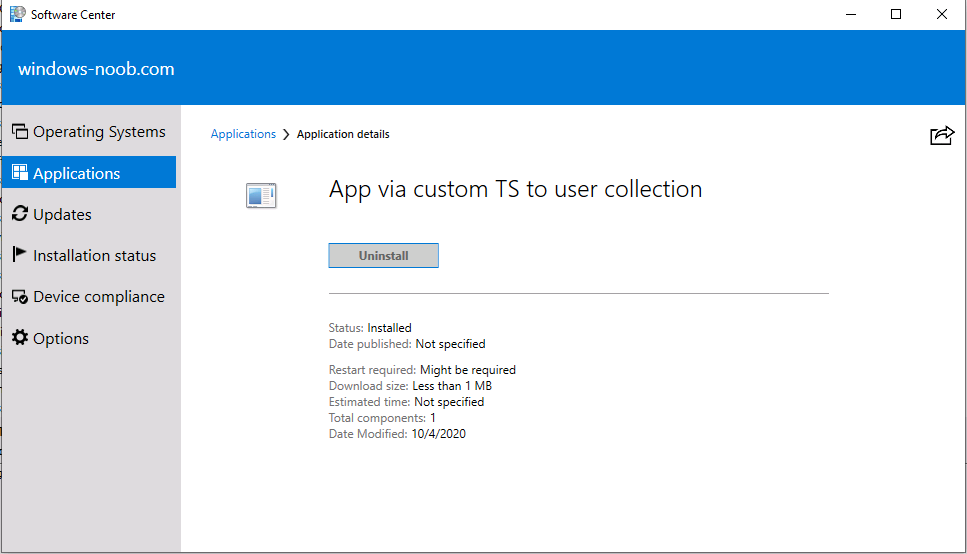
 The custom app you created to deploy the task sequence to users will show up in Software Center in the Applications tab as this is a NON-OSD task sequence.
Shortcuts to status messages
Based on your UserVoice feedback, you now have an easier way to view status messages for the following objects:
- Devices
- Users
- Content
- Deployments
- Monitoring workspace
- Phased deployments (select Show Deployments from the Phased Deployments node)
- Deployments tab in the details pane for:
- Packages
- Task sequences
- Monitoring workspace
So let’s try it on a device, I select a computer object in the Devices node and expand the ribbon view, when I do so I can see the Show Status Messages icon present.
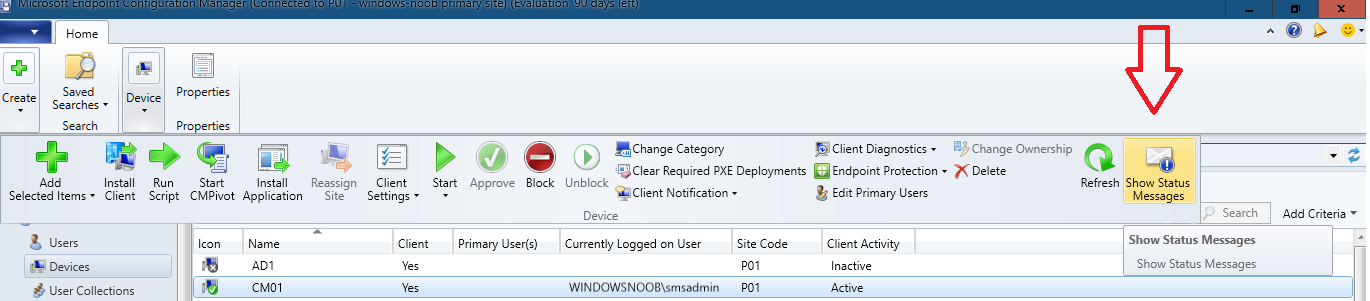 This is also present when you right click the object.
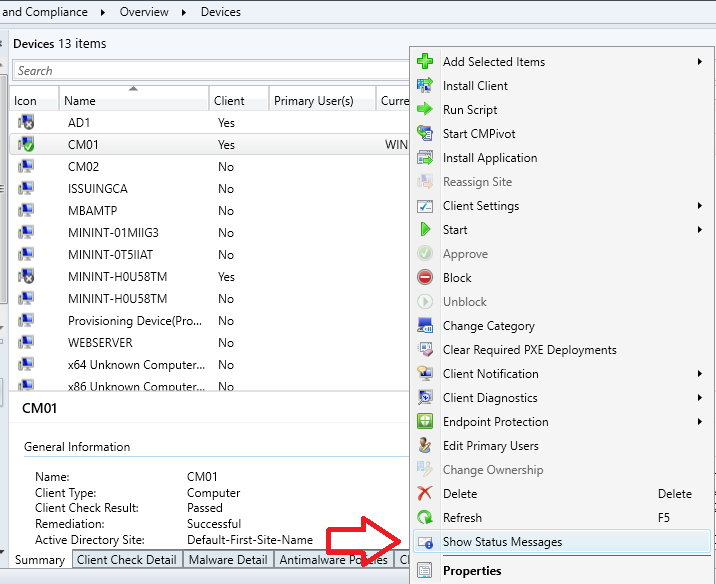
And initiating the action reveals status messages for the time period you selected

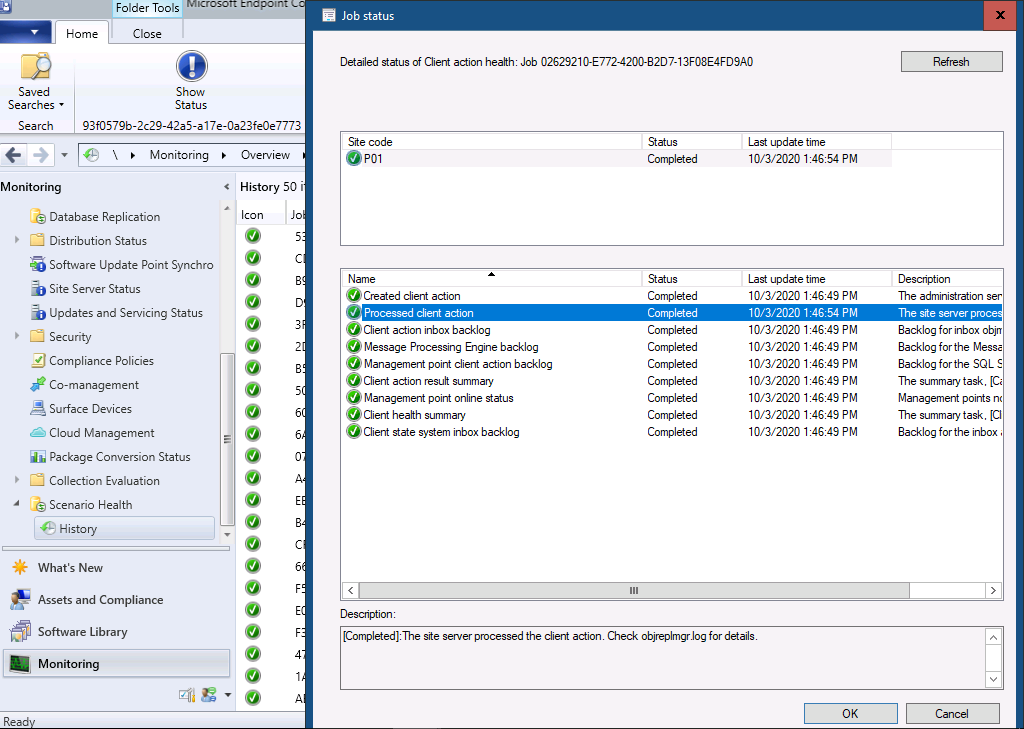
Improvements to scenario health
Technical preview version 2008 added the ability to monitor scenario health, which initially focused on SQL Server Service Broker. In this release, you can now monitor the health of the fast channel used for client actions. If your environment is tenant attached with devices uploaded, this feature helps you see potential issues with client actions from the Microsoft Endpoint Manager admin center. You can also use this feature for on-premises client actions. For example, CMPivot, run scripts, and device wake-up.
So let’s take a look, go to monitoring, and select Scenario Health.
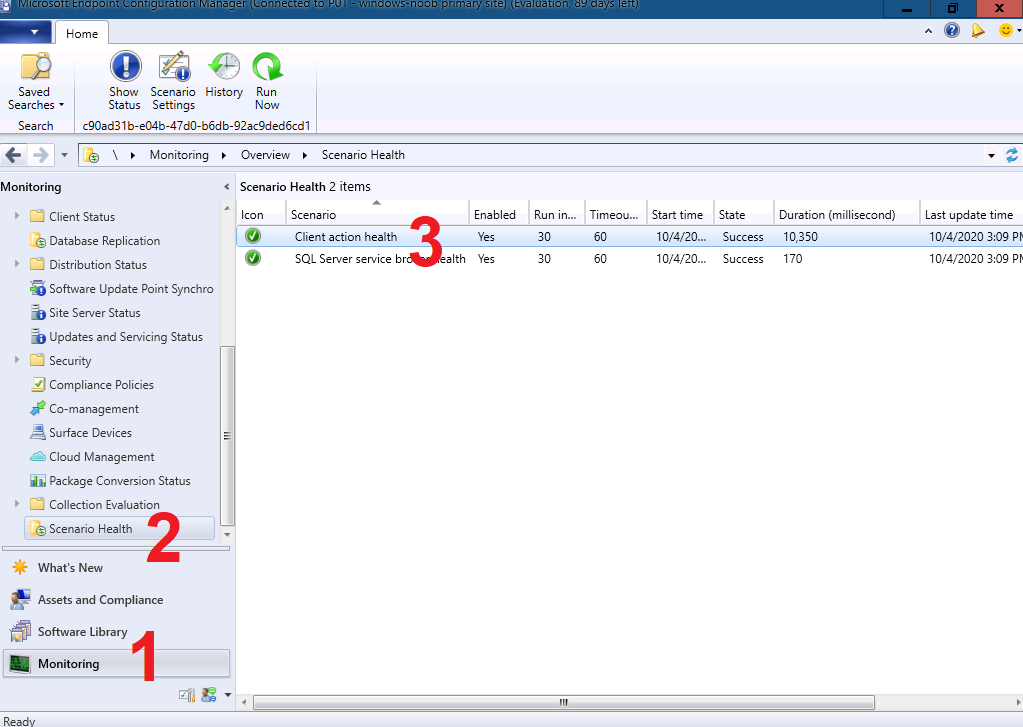 and you have options such as Show Status, or show history to see what has been going on with your Client Action health.