
System Center Configuration Manager Technical Preview 1809 was released a few days ago (2018/9/12), and I finally got around to updating to it in my lab. This is the latest release in a long line of Technical Preview releases.
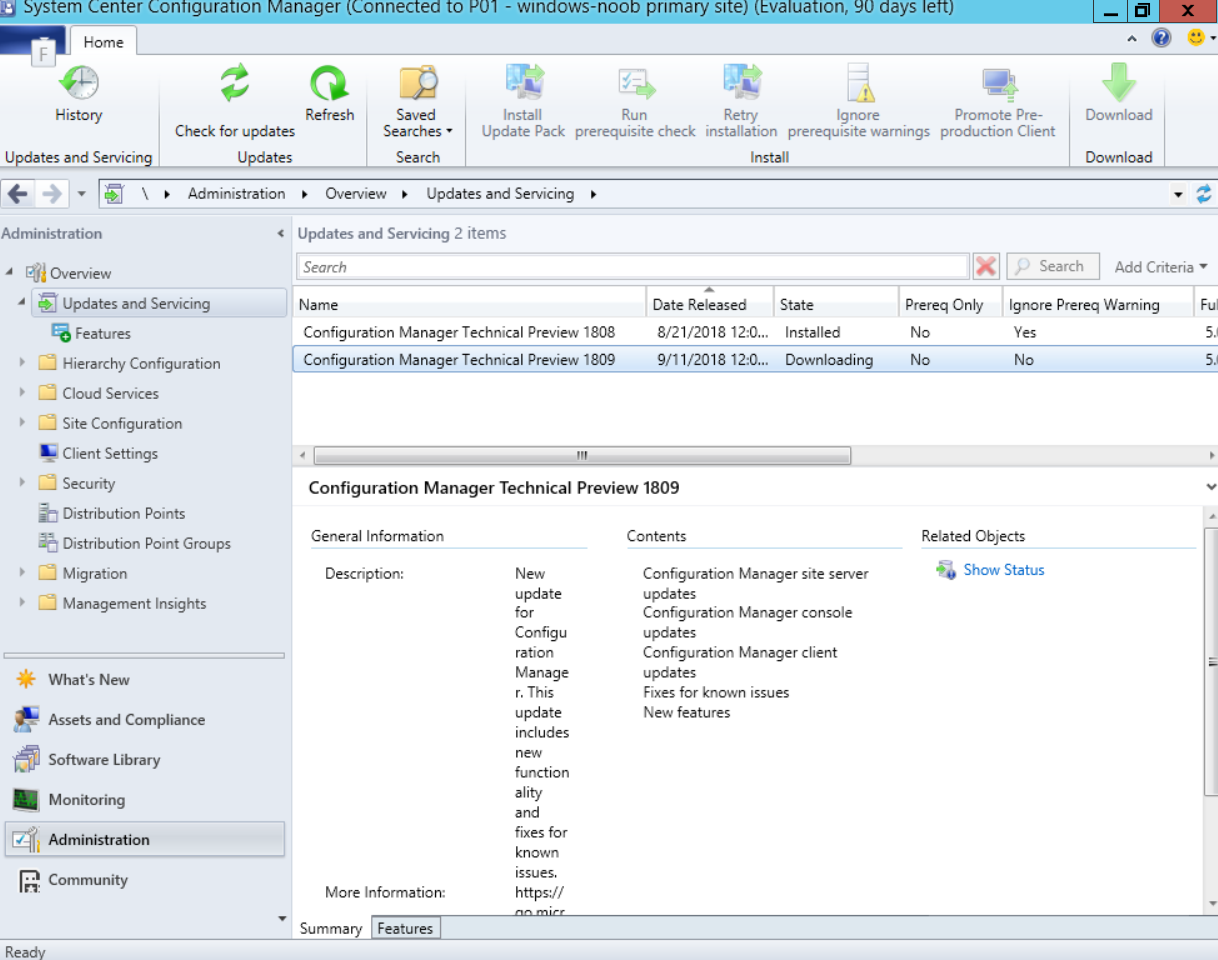
To get it, you must be using a Technical Preview release of System Center Configuration Manager, then select Updates and Servicing node in Administration, click on Check for Updates and it will start downloading the new release.
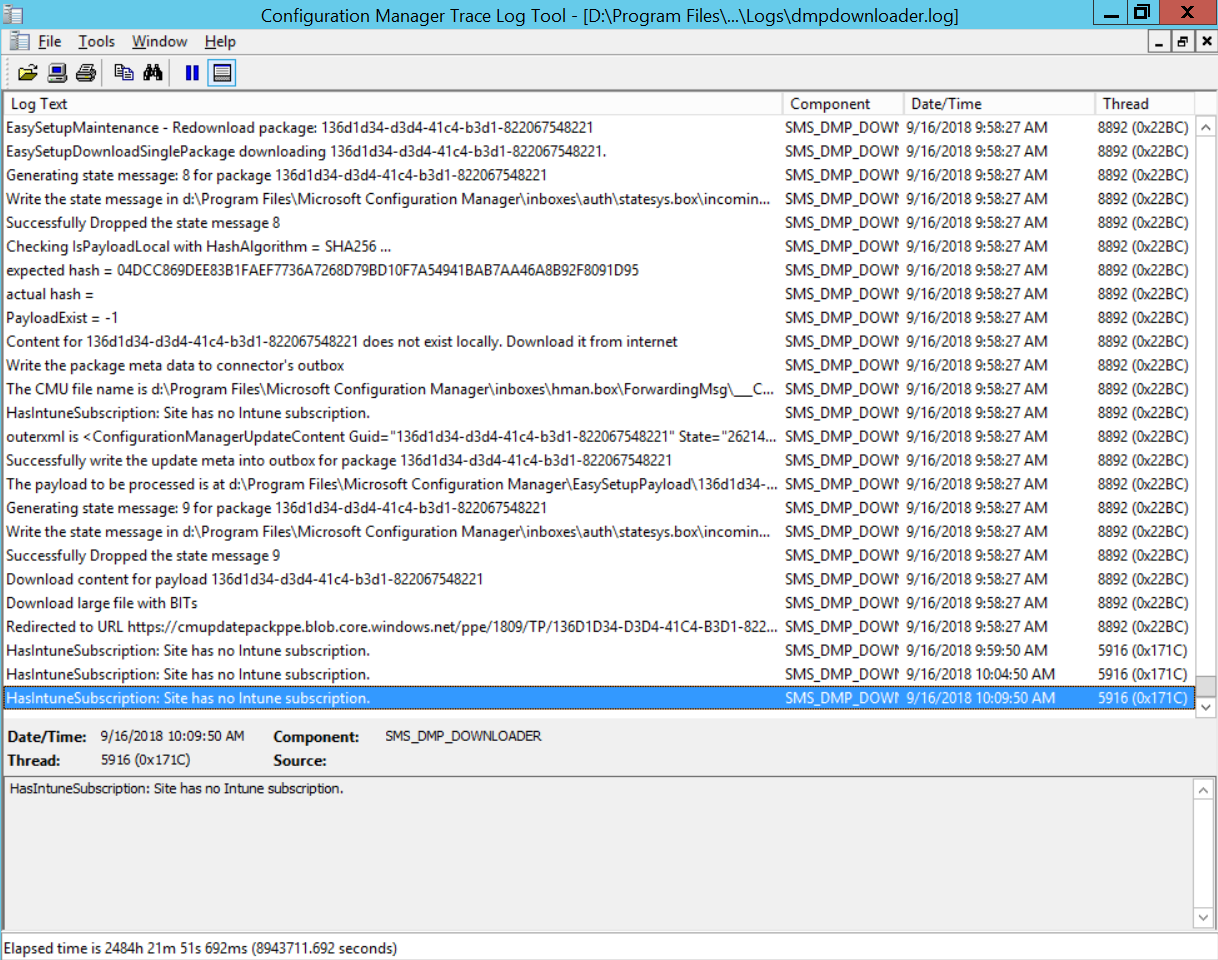
You can monitor the download progress in the DMPDownloader.log using Cmtrace.
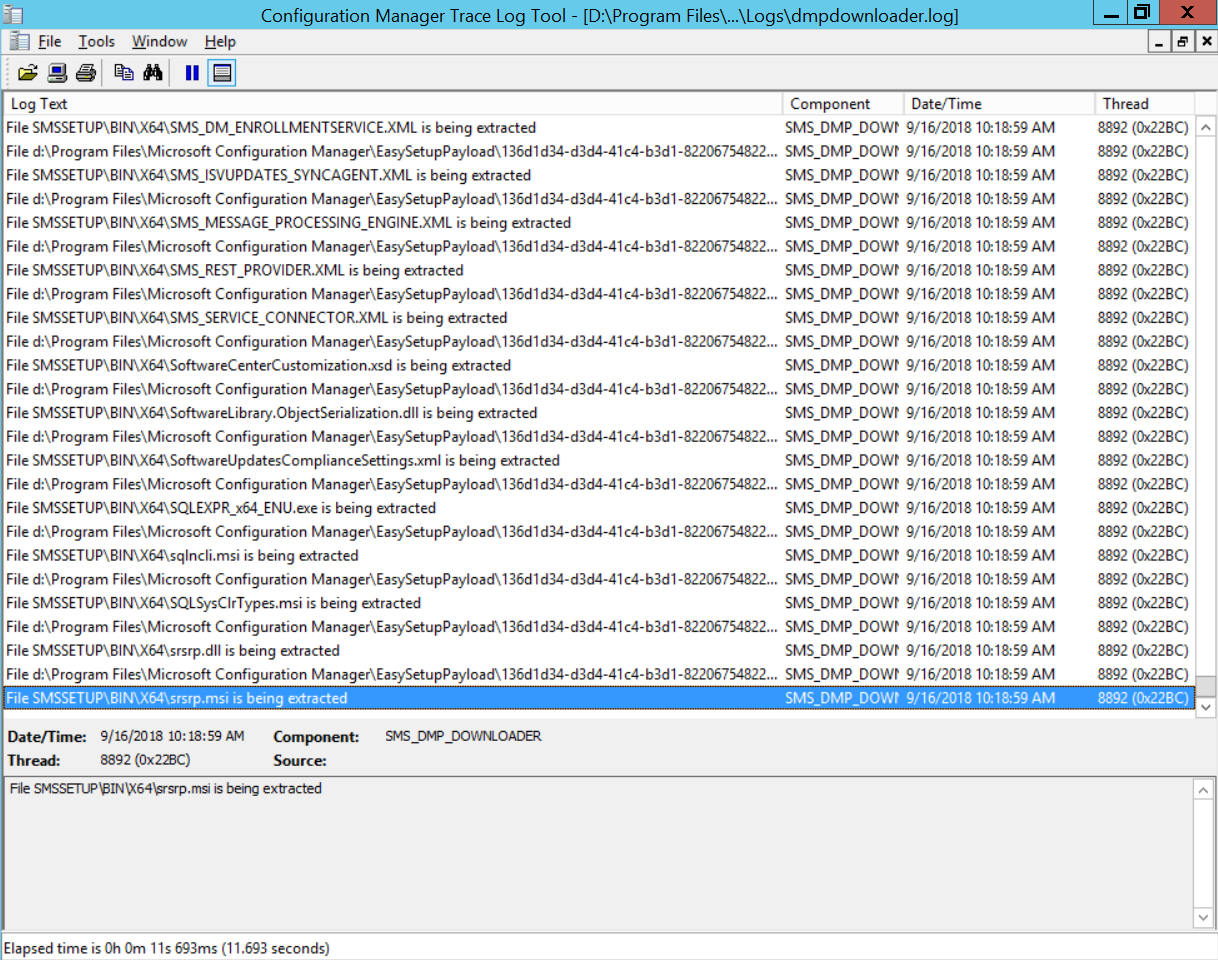
After downloading the content, it will start extracting it.
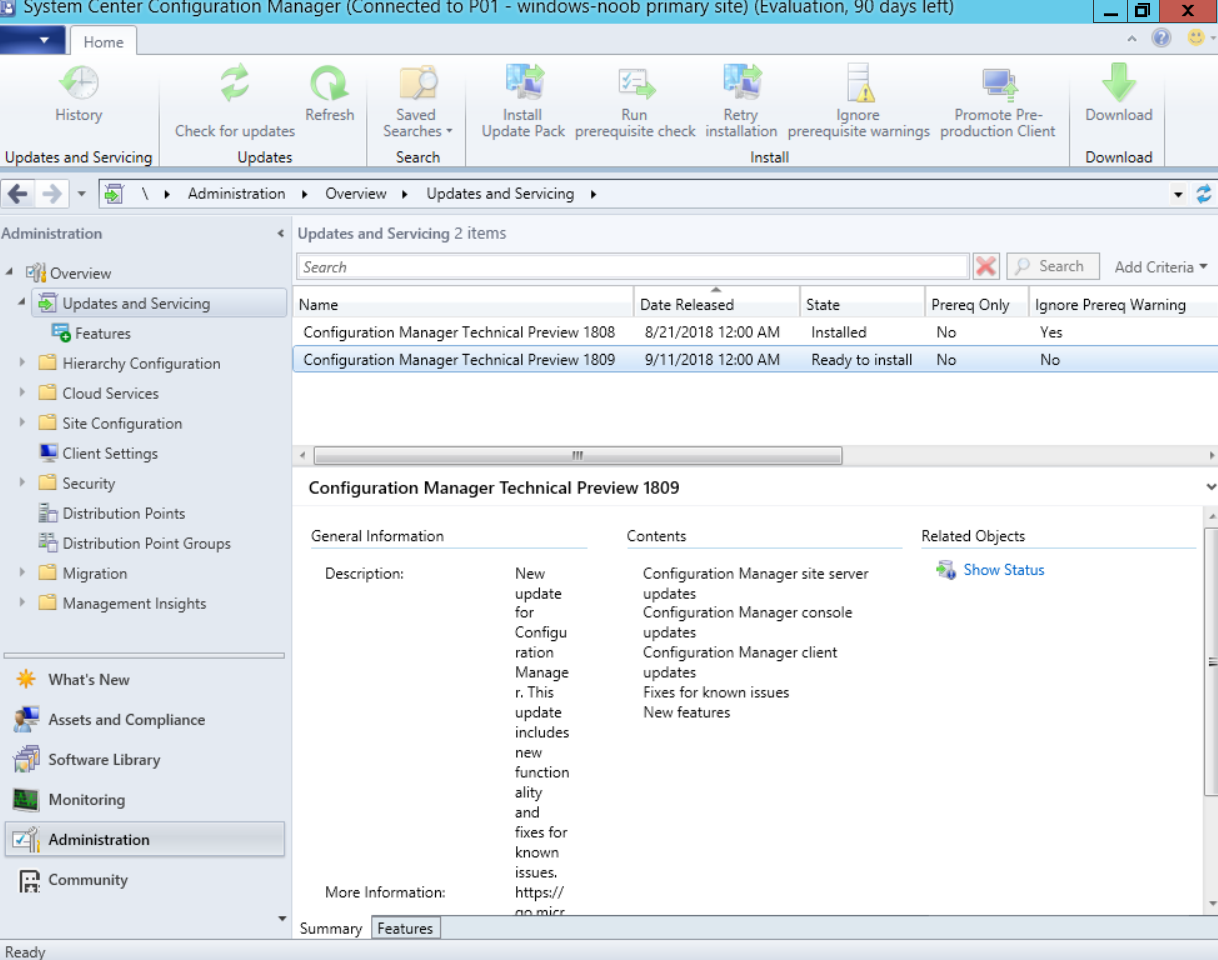
And assuming it extracts everything correctly, you’ll get a Ready to Install status.
So right click the Update and choose Install Update Pack. Click your way through the wizard 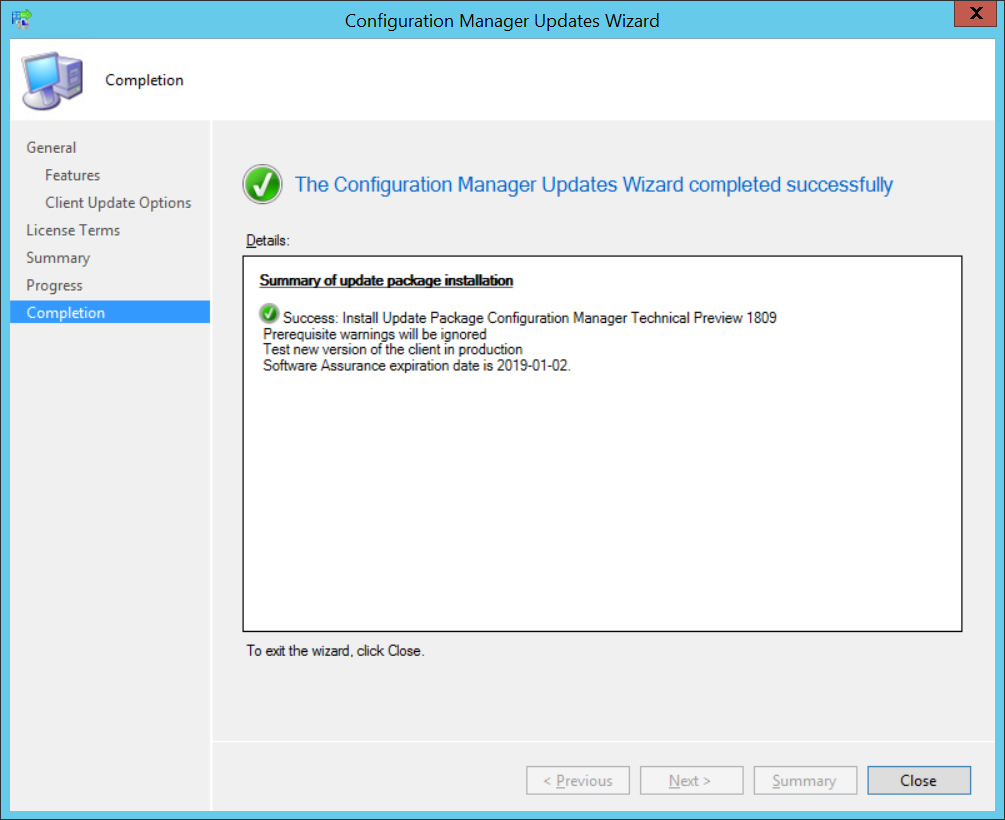
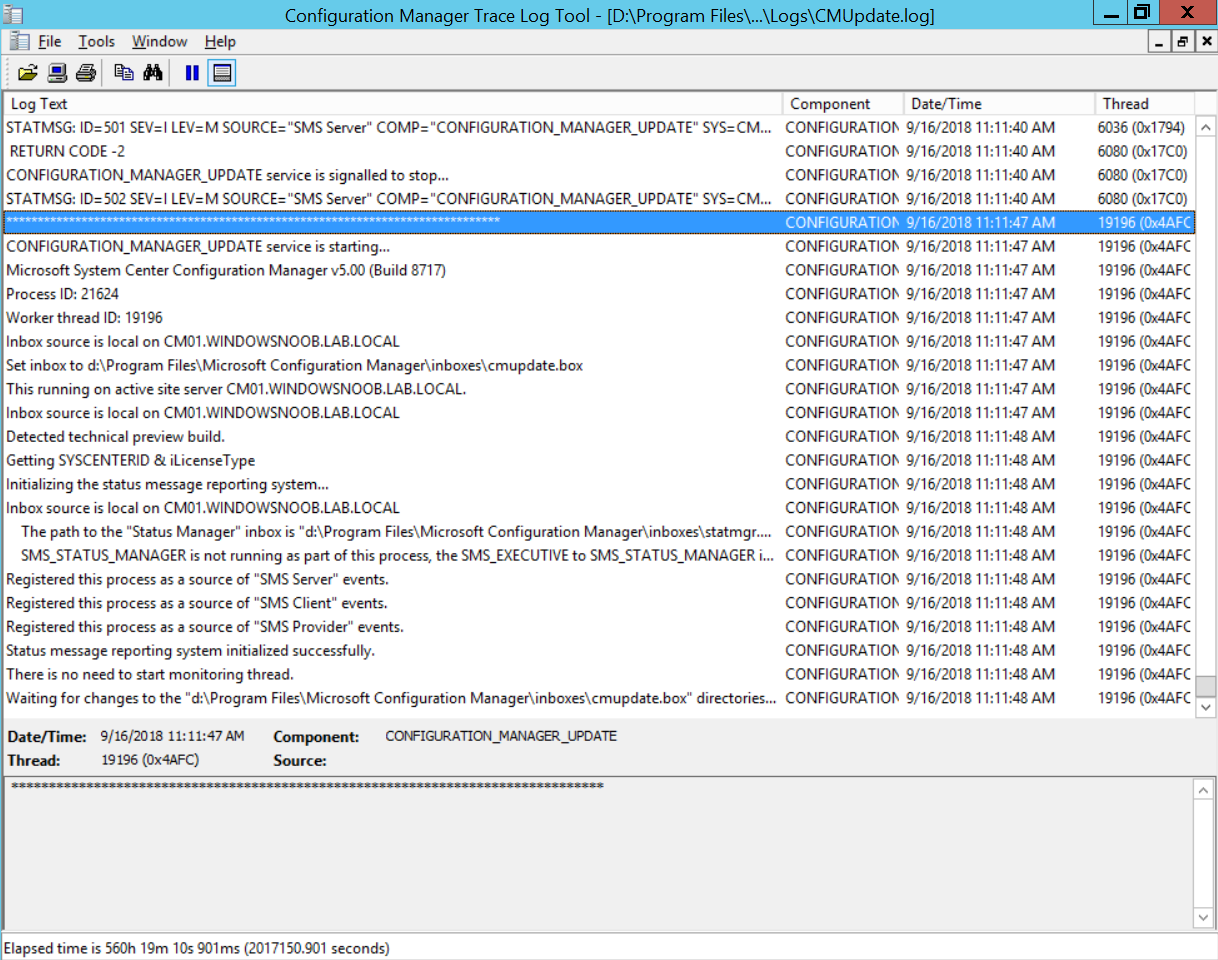
and then open CMupdate.log to review how the upgrade is coming along.
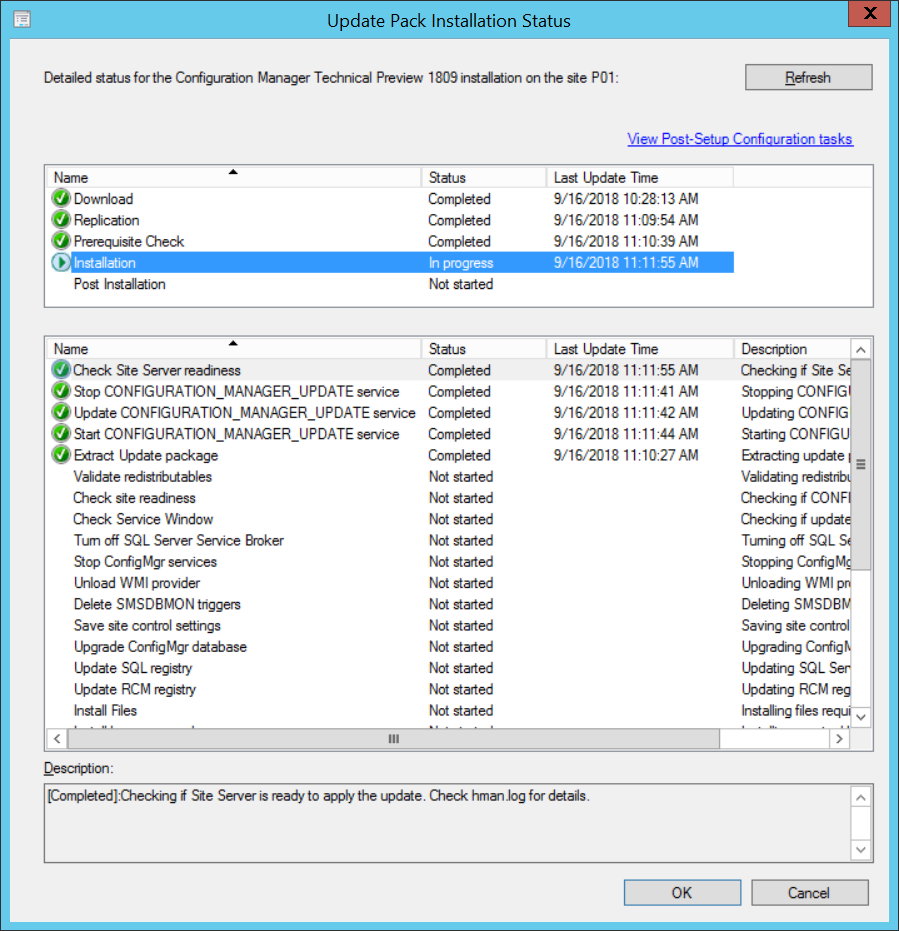
You can also click on Show Status to get an overview of what phase the upgrade is in and what step it’s currently on.
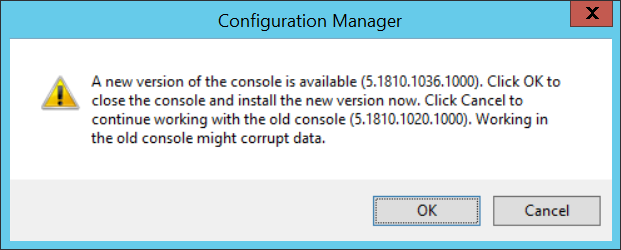
Once the upgrade is complete, clicking around in the console will prompt you to upgrade the console to the newer version
and finally you get to see the What’s new in 1809 console.
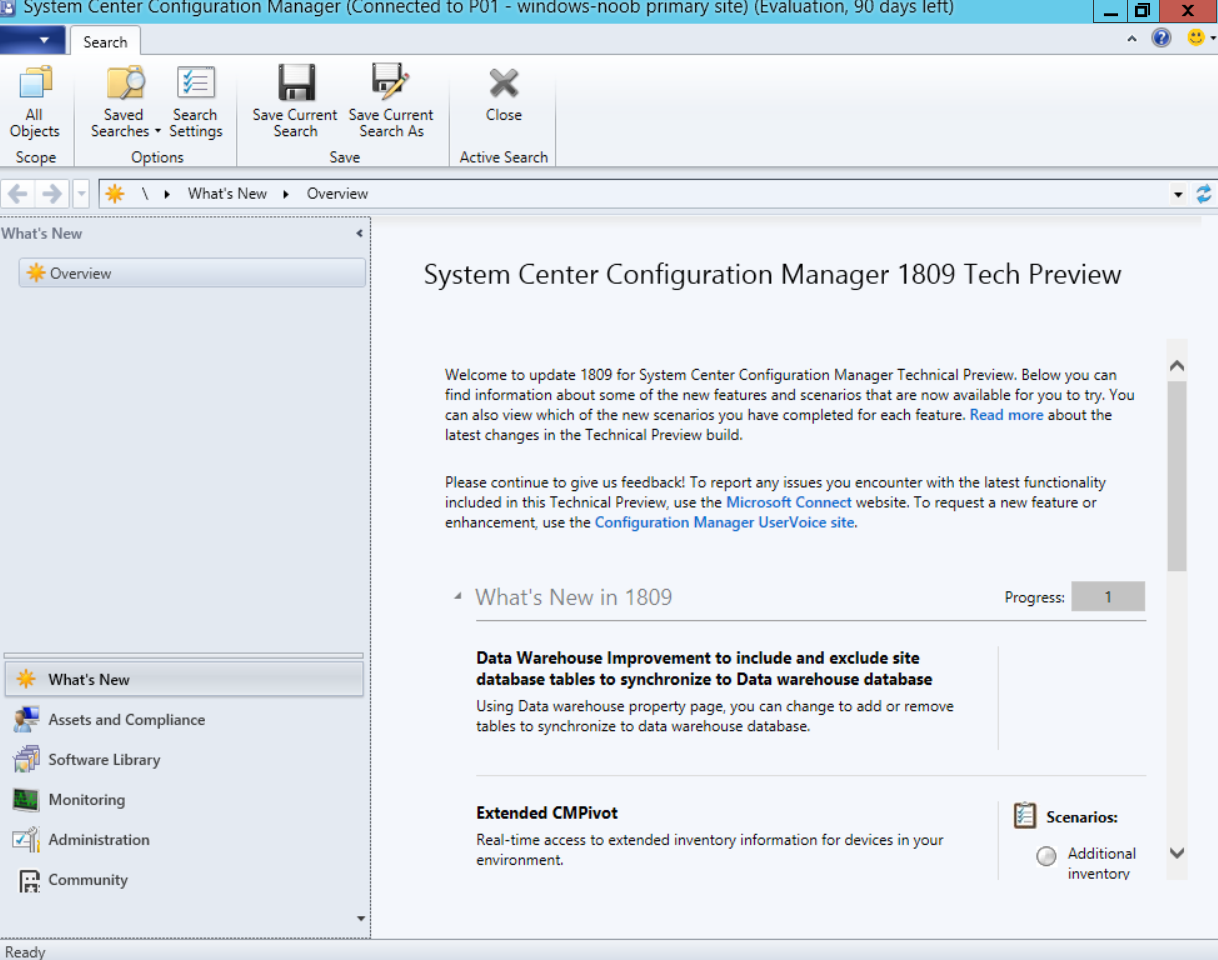
And there’s plenty new, see the capabilities listed below
https://docs.microsoft.com/en-us/sccm/core/get-started/capabilities-in-technical-preview-1809
Improvements to CMPivot
CMPivot includes the following improvements:
For more general information, see CMPivot.
Scalar functions
CMPivot supports the following scalar functions:
- ago(): Subtracts the given timespan from the current UTC clock time
- datetime_diff(): Calculates the calendar difference between two datetime values
- now(): Returns the current UTC clock time
- bin(): Rounds values down to an integer multiple of a given bin size
Note
The datetime data type represents an instant in time, typically expressed as a date and time of day. Time values are measured in 1-second units. A datetime value is always in the UTC time zone. Always express date time literals in ISO 8601 format, for example, yyyy-mm-dd HH:MM:ss
Examples
datetime(2015-12-31 23:59:59.9): A specific date time literalnow(): The current timeago(1d): The current time minus one day
Rendering visualizations
CMPivot now includes basic support for the Log Analytics render operator. This support includes the following types:
- barchart: First column is x-axis, and can be text, datetime or numeric. The second columns must be numeric and is displayed as a horizontal strip.
- columnchart: Like barchart, with vertical strips instead of horizontal strips.
- piechart: First column is color-axis, second column is numeric.
- timechart: Line graph. First column is x-axis, and should be datetime. Second column is y-axis.
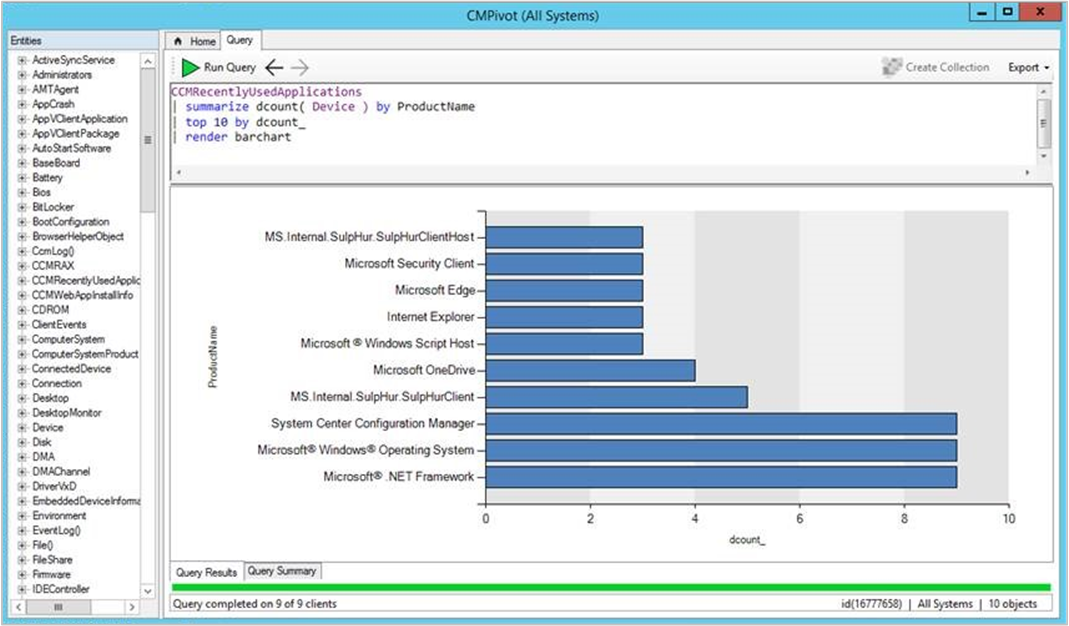
Example: bar chart
The following query renders the most recently used applications as a bar chart:
CCMRecentlyUsedApplications
| summarize dcount( Device ) by ProductName
| top 10 by dcount_
| render barchart
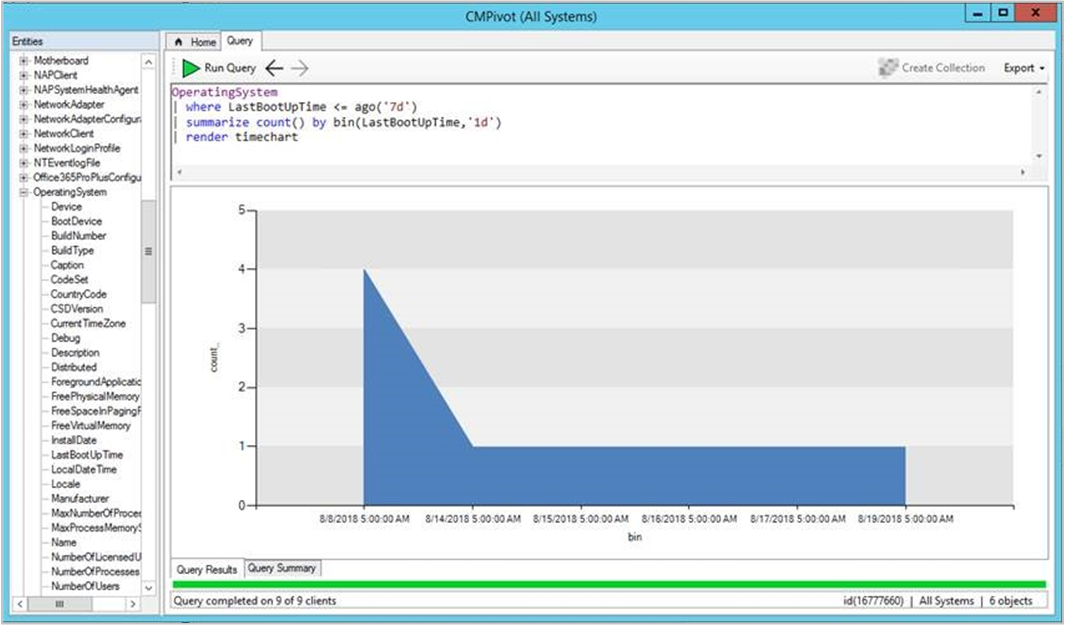
Example: time chart
To render time charts, use the new bin() operator to group events in time. The following query shows when devices have started in the last seven days:
OperatingSystem
| where LastBootUpTime <= ago(7d)
| summarize count() by bin(LastBootUpTime,1d)
| render timechart
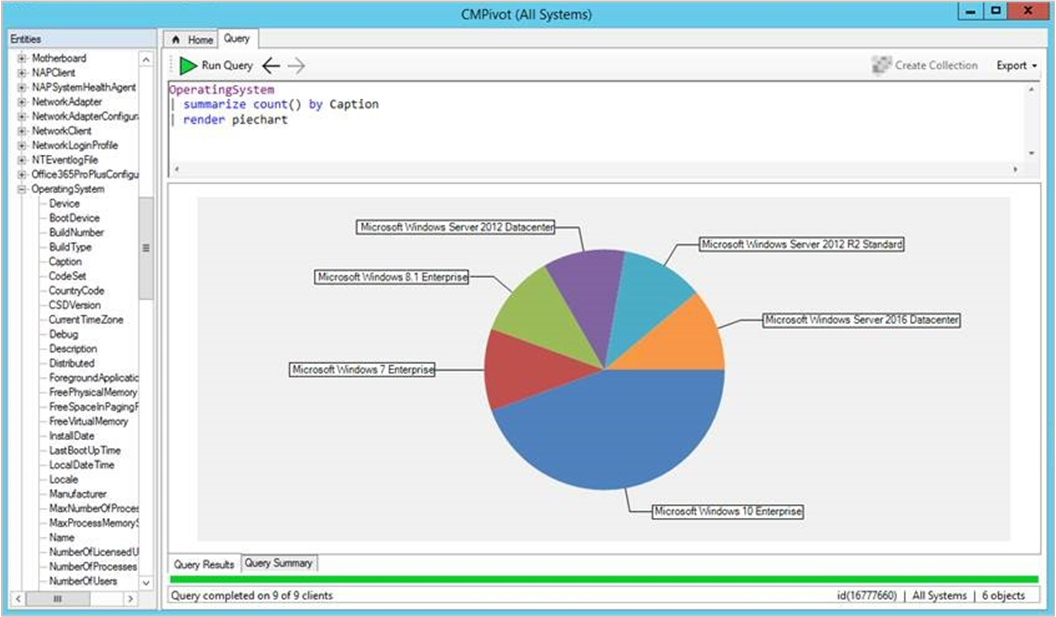
Example: pie chart
The following query displays all OS versions in a pie chart:
OperatingSystem
| summarize count() by Caption
| render piechart
Hardware inventory
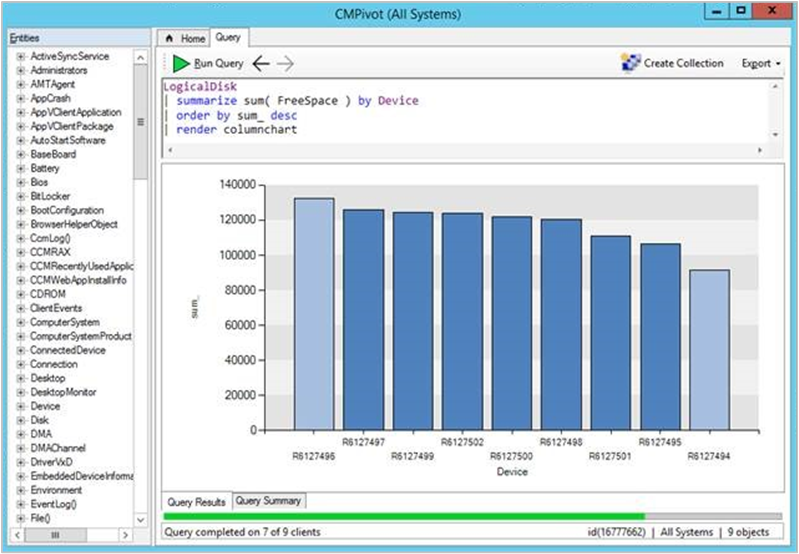
Use CMPivot to query any hardware inventory class. These classes include any custom extensions you make to hardware inventory. CMPivot immediately returns cached results from the last hardware inventory scan stored in the site database. At the same time, it updates the results if necessary with live data from any online clients.
The color saturation of the data in the results table or chart indicates if the data is live or cached. For example, dark blue is real-time data from an online client. Light blue is cached data.
Example
LogicalDisk
| summarize sum( FreeSpace ) by Device
| order by sum_ desc
| render columnchart
Limitations
- The following hardware inventory entities aren’t supported:
- Array properties, for example IP address
- Real32/Real64
- Embedded object properties
- Inventory entity names must begin with a character
- You can’t overwrite the built-in entities by creating an inventory entity of the same name
Scalar operators
Based on your feedback, CMPivot includes the following scalar operators:
Note
- LHS: string to the left of the operator
- RHS: string to the right of the operator
| Operator | Description | Example (yields true) |
|---|---|---|
| == | Equals | "aBc" == "aBc" |
| != | Not equals | "abc" != "ABC" |
| like | LHS contains a match for RHS | "FabriKam" like "%Brik%" |
| !like | LHS doesn’t contain a match for RHS | "Fabrikam" !like "%xyz%" |
| contains | RHS occurs as a subsequence of LHS | "FabriKam" contains "BRik" |
| !contains | RHS doesn’t occur in LHS | "Fabrikam" !contains "xyz" |
| startswith | RHS is an initial subsequence of LHS | "Fabrikam" startswith "fab" |
| !startswith | RHS isn’t an initial subsequence of LHS | "Fabrikam" !startswith "kam" |
| endswith | RHS is a closing subsequence of LHS | "Fabrikam" endswith "Kam" |
| !endswith | RHS isn’t a closing subsequence of LHS | "Fabrikam" !endswith "brik" |
Query summary
Select the Query Summary tab at the bottom of the CMPivot window. This status helps you identify clients that are offline, or troubleshoot errors that may occur. Select a value in the Count column to open a list of specific devices with that status.
For example, select the count of devices with a Failure status. See the specific error message, and export a list of these devices. If the error is that a specific cmdlet isn’t recognized, create a collection from the exported device list to deploy a Windows PowerShell update.
Improvement to lifecycle dashboard
The product lifecycle dashboard now includes information for System Center 2012 Configuration Manager and later. For more information on this dashboard, see Use the Product Lifecycle dashboard.
Improvement to data warehouse
Based on your UserVoice feedback, you can now synchronize more tables from the site database to the data warehouse. This change allows you to create more reports based on your business requirements.
Try it out!
Try to complete the tasks. Then send Feedback with your thoughts on the feature.
- In the Configuration Manager console, go to the Administration workspace. Expand Site Configuration, and select the Servers and Site System Roles node.
- Select the site system with the data warehouse service point role. In the Site System Roles pane at the bottom, select the Data Warehouse service point role. In the ribbon on the Site Role tab, select Properties.
- Switch to the Synchronization Settings tab. Select the option to Select tables.
- In the Database tables window, select the table names to synchronize to the data warehouse database. Use the filter to search by name, or select the drop-down list to choose specific groups.
Note
You can’t remove tables that the role selects by default.
Improvement to maintenance windows for software updates
If a device has more than one maintenance window applied, the client may ignore some windows.
For example:
- All deployment maintenance window: 02:00 – 04:00
- Software updates maintenance window: 04:00 – 06:00
The client only installs software updates during the second maintenance window. It ignores the maintenance window for all deployments in this scenario.
Starting in this technical preview version, the following client setting is in the Software Updates group to control this behavior:
Enable installation of updates in “All deployments” maintenance window when “Software update” maintenance window is available
By default, this option is No to keep consistent with the existing behavior. Change it to Yes to allow clients to use other available maintenance windows to install software updates.
For more information, see the following articles:

Pingback: A summary of System Center Configuration Manager releases in 2018 and the new features – Part 2 (Technical Preview) | just another windows noob ?